
PRODUCTS
- 首頁
- 經營品牌
- E+H Metrology GmbH
- 軟體
- Waferstudio
Waferstudio
E+H
Waferstudio develops the overview, insight and opens up new perspectives from this. For your production chain, efficiency and yield and quality. Especially in one of the most demanding segments of modern industry, Waferstudio delivers some crucial competitive advantages:
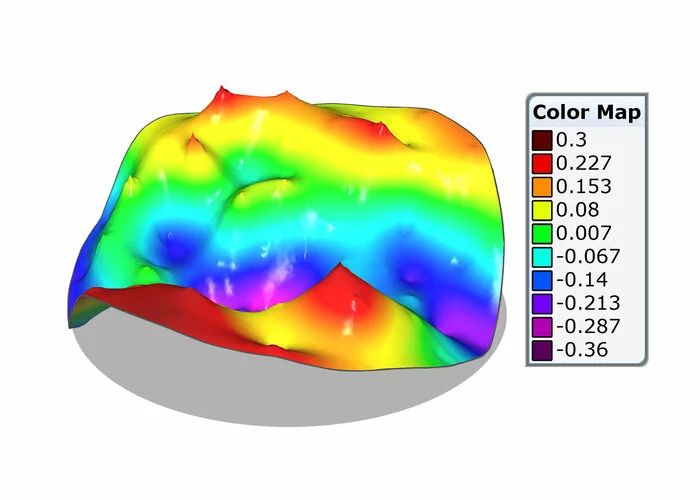
。7 different interpolation methods: The interpolation method decides how realistically the visualization depicts the previous process step. And thus allows to optimize the process. Therefore, Waferstudio offers seven different interpolation methods (most software solutions offer a maximum of 2). The pykophylatic interpolation developed by E+H is specially adapted to the requirements of wafer production. The normalized and customizable full rainbow color scale allows intuitive estimation of height.
。Silhouette: Strong contrasts allow deformations to be recognized at first glance and give a realistic image of the substrate.
。Shading technology: Through shading, the human eye is accustomed to detecting topographical differences in a minimum of time. Our shading technology has therefore been developed to make even the smallest defects visible.
。Light effects: The light effects allow an intuitive perception of the surface texture.
for SECS/GEM, S³O (Simple Soap Server One) and IPC
You want software that not only processes data, but also enables solutions for complex challenges? We developed Waferstudio specifically for optimizing your processes, and so the analysis functions can be used for a variety of individual tasks. Among many others, these are for example:
。Site TIR (Total Indicator Reading): The Site TIR value can be more relevant than the Global TIR value for submicron geometry measurement. Waferstudio maps individual Site TIR measurements according to your needs.
。2D cut function: If, for example, dimples and defects need to be determined more precisely, Waferstudio’s 2D cross-section function is suitable for this purpose.
。Measure Local Standard Deviation: This function makes it possible to quickly and easily determine standard deviations.
。Measurement Comparison: A fundamental problem in process control is comparing measurement results from completely different tools. Waferstudio’s measurement comparison feature allows you to get a perfect comparison overview in just a few steps, even for completely different measurement methods.
Waferstudio
Understand your data at first sight with our customizable, visual analysis Waferstudio software
WHICH SOFTWARE fits my needs?
Please contact us.